Uncategorised
Does winning matter? Helping NHL teams boost ticket sales

At Canopy Labs, we are curious about how a sports team’s fan base grows and shrinks in relation to its performance. Starting with the NHL, in this post we will explore how performance affects ticket sales in different markets and conclude with a set of tips how ticket vendors can use these insights to boost sales.
When does winning matter?
Read MoreUncategorised
Three Awesome Ways to Visualize Customer Data

The amount of data around us is exploding. Eric Schmidt once said that every 2 days, we create as much information as we did up to 2003… And that was back in 2010! We can answer more questions, using more tools, than ever before.
The drawback, of course, is choosing the right ones. Increasingly, data visualization is proving invaluable for sales and marketing teams seeking to understand their customer base, and to discover nuanced customer trends often hidden in a sea of numbers. Today, we are featuring some of the best data visualizations on the web and their potential as sales and marketing tools.
Read MoreUncategorised
What is “Customer Success”?

In recent months, the term Customer Success has been getting more interest from companies, particularly for those focused on online sales. “Customer success” however is still a largely ambiguous idea, one that few companies have actively explored and engaged with. In light of this week’s Pulse Customer Success conference, we thought it would be helpful to discuss the term in detail, explain what it actually means, and outline how your company can strategize around it.
From Customer Service to Success
Read MoreUncategorised
The Five Most Quirky Shopify Stores

At Canopy Labs, we’re always on the lookout for new and interesting Shopify stores to work with. Every now and then, we come across some very unique products sold with Shopify that we just have to share! Here are a few of these stores today.
Read MoreUncategorised
Model Performance Differs by Analytics Tool — A Tale of Caution
Business analysts rarely give much thought to the analytics tools they use, and usually just use the software already available in their enterprise. Even more commonly seen is the use of default settings within such systems — strapped for time, analysts and reporting staff will use the default settings in their software packages to complete tasks on time. This is risky, as default settings are not always the best ones to use for specific business problems or modeling tasks.
We recently performed an analysis to see how much machine learning and statistics tools differ in performance when using the same methods, and the results surprised us. Given three different software tools, using the same approach results in model performance that can vary by as much as 200% in some metrics.
Read MoreUncategorised
New Features in the Canopy Labs Platform
We are excited to announce a new set of features to the Canopy Labs platform this week. These features have been under development for the past few months, and are now available to all users and customers. They are the result of your valuable feedback, support, and advice. If you ever want to learn more and see other new models, dashboards, or other tools, please let us know.
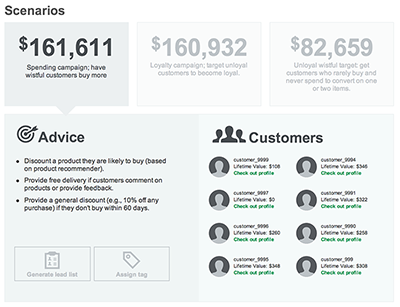
- Scenarios. With Scenarios, our platform explores your customer segments and groupings to track which ones are the biggest opportunities for your sales and marketing campaigns. Not only do we pre-generate lead lists for each campaign, but we also provide you with estimates around incremental revenue. You’ll take comfort in knowing that these scenarios are the most profitable for your company, and your lead lists will be automatically updated to provide the most relevant customers for future campaigns.
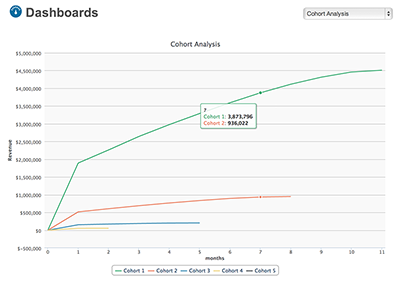
- Custom dashboards. You can now build fully customized dashboards in our platform. These dashboards can focus on high-level sales numbers, specific campaigns, or any custom models that you build. We will release new widgets and data visualizations regularly, all of which will be available on the platform’s dashboard tool.
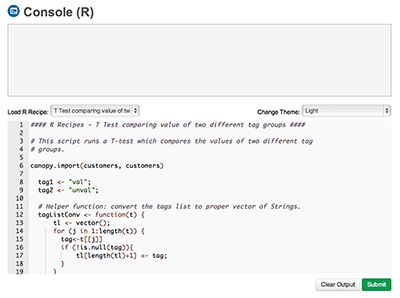
- Statistics programming console. If you’re keen on building your own models or developing new metrics, we are now providing statistical scripting support (using the R statistical programming language) to analyze your customer data. The data itself is preloaded, so all you have to worry about is scripting. Model results and data generated in the console are available through your custom dashboards, too.
We’d love to show you around the platform and illustrate the features above. Request a free demo and we’ll be in touch soon.
Read MoreUncategorised
Elements of a 360 Degree Customer View
Marketers, sales teams, and IT professionals often talk about the importance of having a unified 360 degree customer view. This is important because it provides your entire company with full customer profiles all in one place — imagine being able to log in and see a Facebook-like timeline of how individuals interact with, and buy from, your company.
From a customer data perspective, you can only make accurate decisions about customer offers, market segmentations, and other campaigns when you have access to such a view. These views are often the responsibility of IT teams, as they centralize data to make such a view possible. However, they are ultimately used by sales and marketing teams without much technical knowledge. With that in mind, a 360 customer view needs to be tailored to the needs of your sales team – in other words, the view needs to be visual, easy to use, and focused on actually generating sales or improving customer service.
Read MoreUncategorised
Service to Sales (S2S): Four Tips to Grow Inbound Sales
We hear it all the time: outbound selling is old news, and inbound sales are better. Content marketing is the rule of law online: build a brand and build compelling content, and let your customers come to you rather than the opposite.
Enabling such an inbound capability is difficult, particularly if your company is dealing with real-time interactions like call centre calls or online chat systems. The investment is worth it, however: such inbound leads are also some of the biggest opportunities for driving sales and revenue.
Read MoreUncategorised
The Customer Data Grid: A Sales-Oriented Segmentation
Several weeks ago, we discussed the four dimensions of customer value as a way to track and measure opportunities among your customers. Using a number of dimensions for value helps you understand why customers are valuable, and as a result, which ones you should prioritize. As a brief recap, customers who bring in revenue are wonderful but not the only ones your sales team should be reflecting on. Loyal customers imply regular revenue, while customers not spending much money can still engage with your brand (think about the cross-sell and up-sell opportunities) or tell their friends (if they have positive, happy experiences).
With this in mind, we introduce the next iteration of our research and analysis: the Customer Value Segmentation. This segmentation is driven by the four dimensions of customer value, and pave the way for simple, business-oriented rules to help with your marketing campaigns and sales planning. The grid is illustrated below:
Read MoreUncategorised
Prescriptive Analytics: The Next Step in Big Data
As the discussions around Big Data continue, business professionals are becoming more aware of the challenges and pains of using analytics within their companies. Managers, professionals, and executives are all facing similar problems around investing in expensive IT infrastructure, training their workforce to understand analytic technologies, and rolling out strategies that take into account dashboards and model results. Dealing with these problems is not easy, and a new concept is beginning to emerge in this space: Prescriptive Analytics. If built properly, Prescriptive Analytics tools can help companies deal with the talent shortages and lack of ability to apply models to generate business results.
Prescriptive Analytics is the combination of data mining, model results, business rules and other heuristics to automate the use and application of analytic results. Rather than obtaining model results and deciding how to use them, the workflow is automated to act on the decisions and recommendations automatically. In other words, models (and the IT systems that build them) are designed to actually complete a task or workflow as a result of their analysis.
Read More